 عَين منصة المراقبةAIN OBSERVABILITY
١١ وحدة متكاملة · منصة واحدة 11 INTEGRATED MODULES · ONE PLATFORM
كل وحدة في عَين مصمَّمة لتشتغل لحالها، وفي نفس الوقت تتكامل مع البقية كأنها قطعة واحدة. هذي تفاصيل كل وحدة. Every AIN module operates independently yet integrates with the rest as a single, coherent system. Detailed breakdown below.
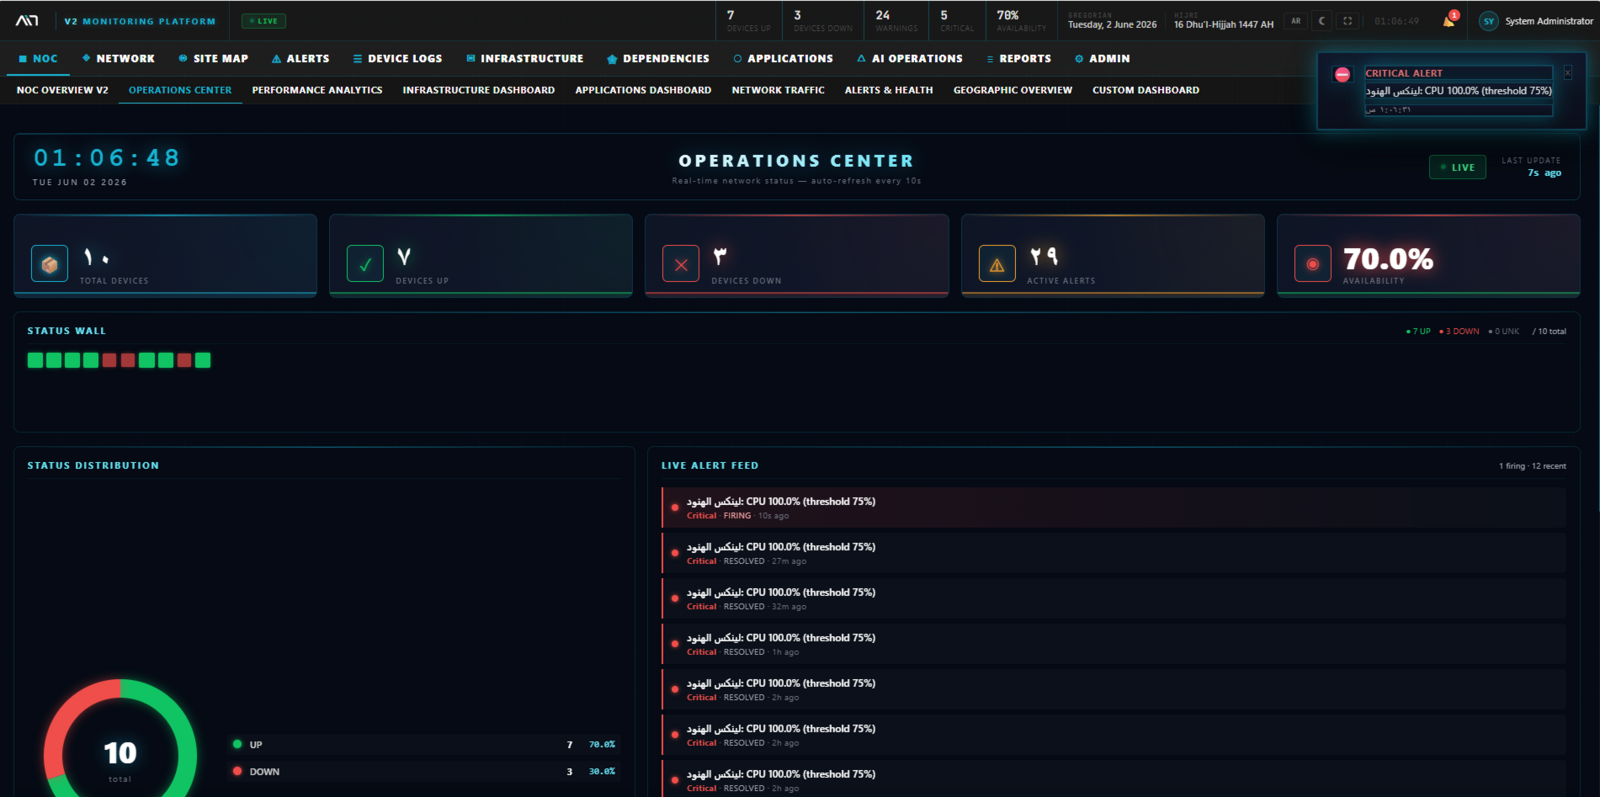
مركز العمليات — قلب المنصّة OPERATIONS CENTER · HEART OF THE PLATFORM
شاشة موحَّدة تجمع كل المؤشرات الحرجة، حتى المراقب الجديد يفهم حالة الشبكة في أقل من ٥ ثوانٍ.A unified screen consolidating every critical KPI — so even a brand-new operator can grasp network health in under 5 seconds.
- NOC Overview v2 — البطاقات الرئيسية: صحة الشبكة، التوفر، الأجهزة، التنبيهات
- Operations Center — جدار الحالة Status Wall + موجز التنبيهات الحيّ
- Performance Analytics — CPU/Memory/Disk عبر الأسطول كاملاً + قائمة "أعلى استهلاك"
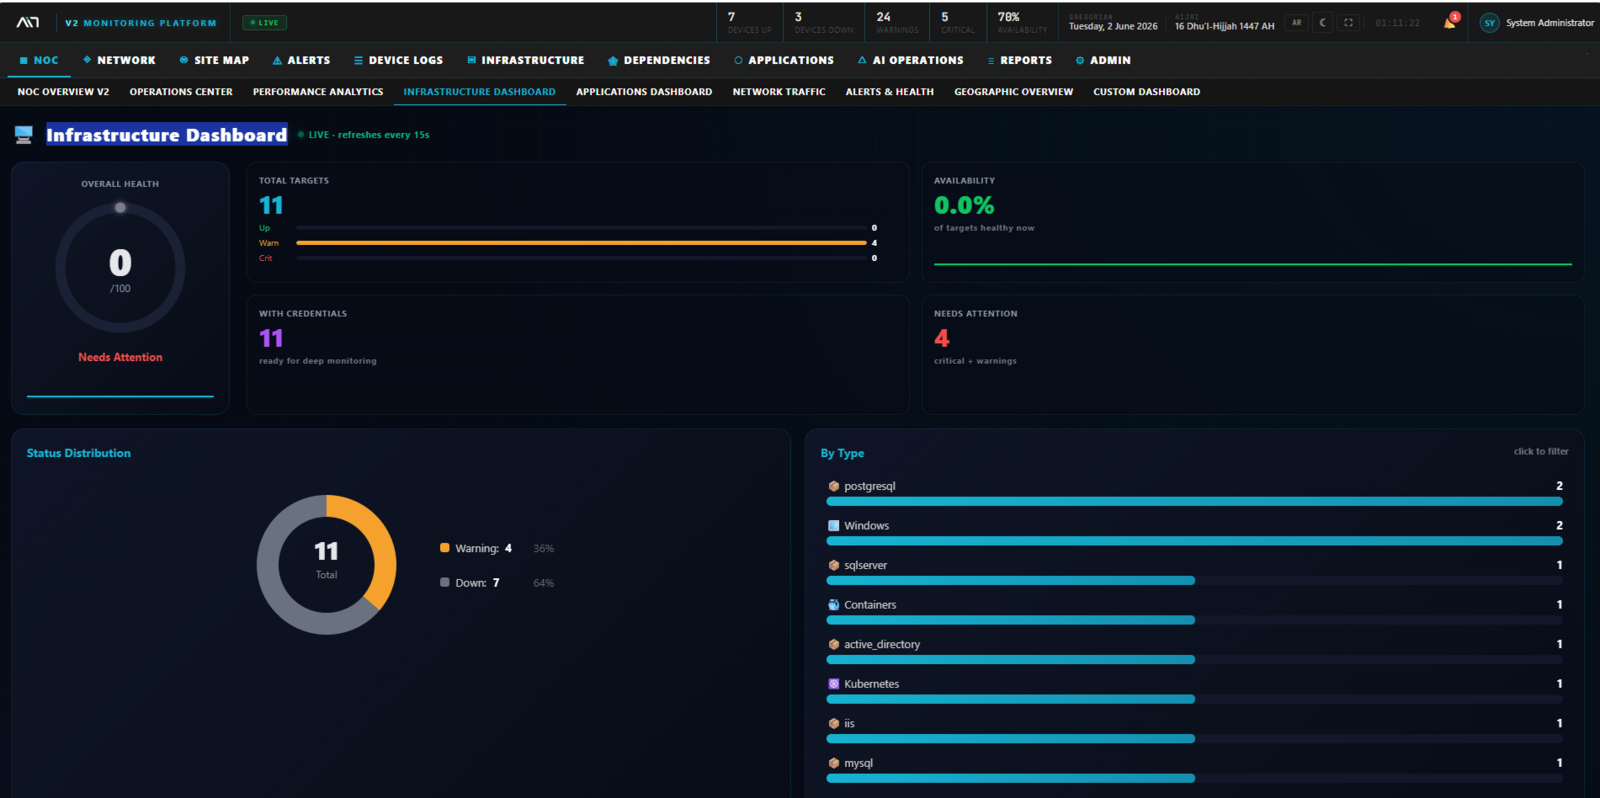
- Infrastructure Dashboard — صحة الخوادم وقواعد البيانات والخدمات
- Applications Dashboard — APM Score + ملخص الاستجابة والأخطاء
- Network Traffic — Bandwidth, Top Talkers, NetFlow analytics
- Alerts & Health — حالة التنبيهات حسب الفئة والخطورة
- Geographic Overview — توزيع الأجهزة على المناطق
- Custom Dashboard — لوحات قابلة للسحب والتخصيص بالكامل
- NOC Overview v2 — main cards: network health, availability, devices, alerts
- Operations Center — Status Wall + live alert feed
- Performance Analytics — CPU/Memory/Disk across the entire fleet + top-consumers list
- Infrastructure Dashboard — health of servers, databases, and services
- Applications Dashboard — APM Score + response and error summary
- Network Traffic — Bandwidth, Top Talkers, NetFlow analytics
- Alerts & Health — alert status by category and severity
- Geographic Overview — device distribution across regions
- Custom Dashboard — fully draggable, customizable panels
إدارة الشبكة من الجذر NETWORK MANAGEMENT · FROM THE GROUND UP
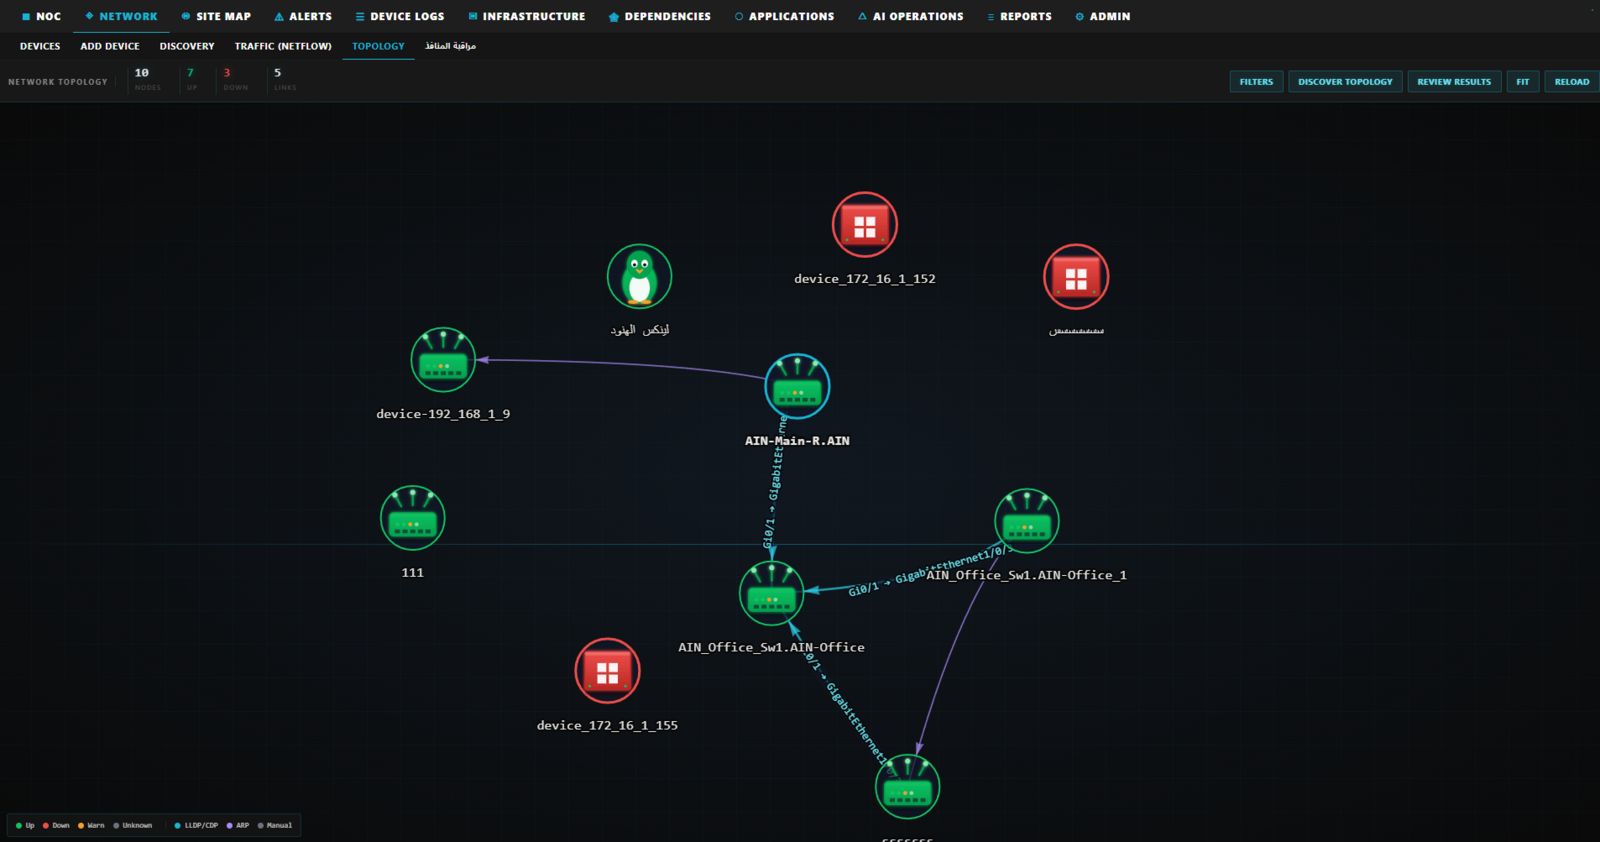
من اكتشاف أول جهاز حتى رسم خريطة الطوبولوجيا الكاملة — كل شي مؤتمت.From discovering the first device to drawing the complete topology map — everything is automated.
- Devices — قائمة موحَّدة لكل الأجهزة مع فلاتر متقدمة
- Add Device — معالج إضافة ذكي مع اكتشاف تلقائي للواجهات
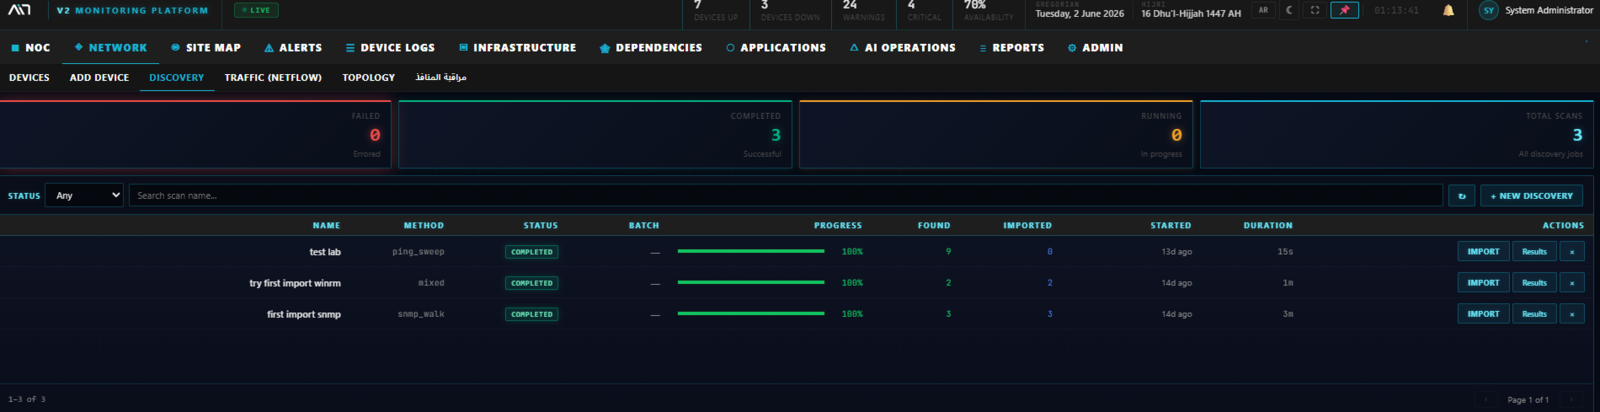
- Discovery — مسح شبكي على نطاقات IP عبر SNMP/SSH/ICMP/WinRM
- Topology — رسم تلقائي للروابط عبر LLDP/CDP/ARP
- Traffic (NetFlow) — تحليل تدفقات v5/v9/IPFIX مع NBAR2
- Interface Monitoring — IF-MIB 32/64-bit، dashboards مخصّصة
- Excel Import — رفع آلاف الأجهزة دفعة واحدة من ملف
- Devices — unified list of every device with advanced filters
- Add Device — smart wizard with automatic interface discovery
- Discovery — network scan across IP ranges via SNMP/SSH/ICMP/WinRM
- Topology — automatic link mapping via LLDP/CDP/ARP
- Traffic (NetFlow) — v5/v9/IPFIX flow analysis with NBAR2
- Interface Monitoring — IF-MIB 32/64-bit, custom dashboards
- Excel Import — bulk-load thousands of devices from a single file
خريطة سعودية كاملة — ٢D و ٣D FULL SAUDI MAP · 2D & 3D VIEWS
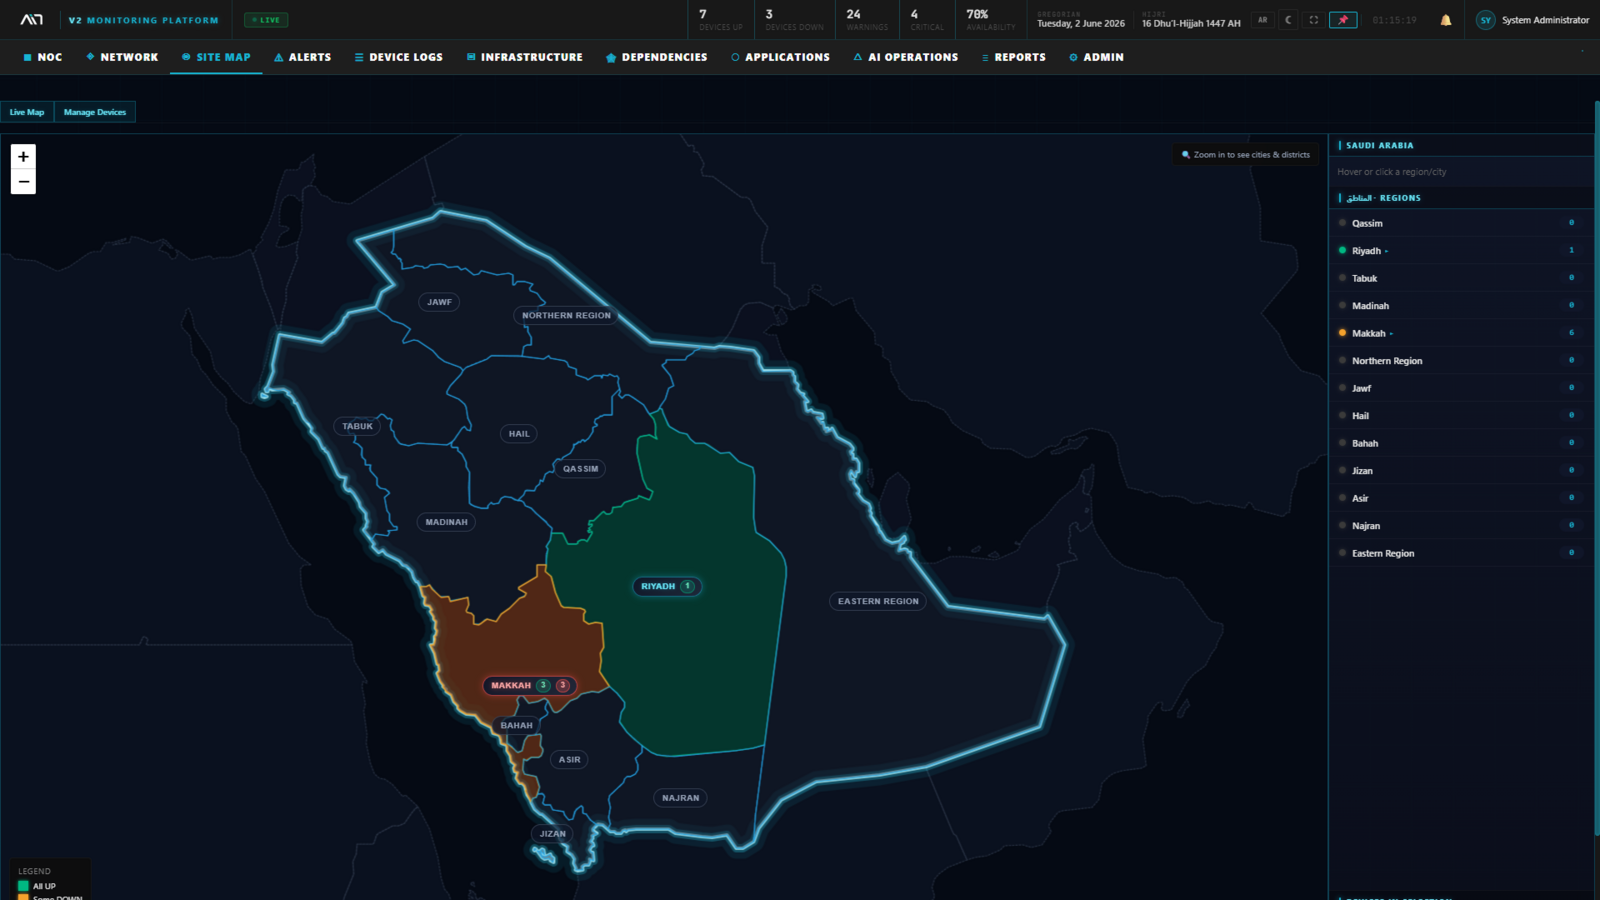
السعودية، مناطقها الـ١٣، مدنها، أحياء الرياض ومكة — كلها في عَين، بدون tiles خارجية.Saudi Arabia, its 13 regions, cities, Riyadh and Makkah districts — all inside AIN with no external tile services.
- عرض Leaflet مع GeoJSON محلي لكل المناطق
- عرض ٣D حضري بـ Three.js — مدن وأبراج إنذار حيّة
- تنقّل هرمي: السعودية → منطقة → مدينة → حي → موقع
- أحياء الرياض ومكة بالتفصيل (GeoJSON الكامل)
- تكبير تلقائي عند النقر على منطقة
- عدّاد أجهزة لحظي + مؤشر صحّة لكل منطقة
- Leaflet view with local GeoJSON for all regions
- 3D urban view via Three.js — cities and live alert towers
- Hierarchical drill-down: Saudi → region → city → district → site
- Riyadh and Makkah districts in full detail (complete GeoJSON)
- Real-time color coding: green / amber / red by location
- Click any region to drill straight to the device level
تنبيهات ما تفوّت شي ALERTS THAT NEVER MISS A BEAT
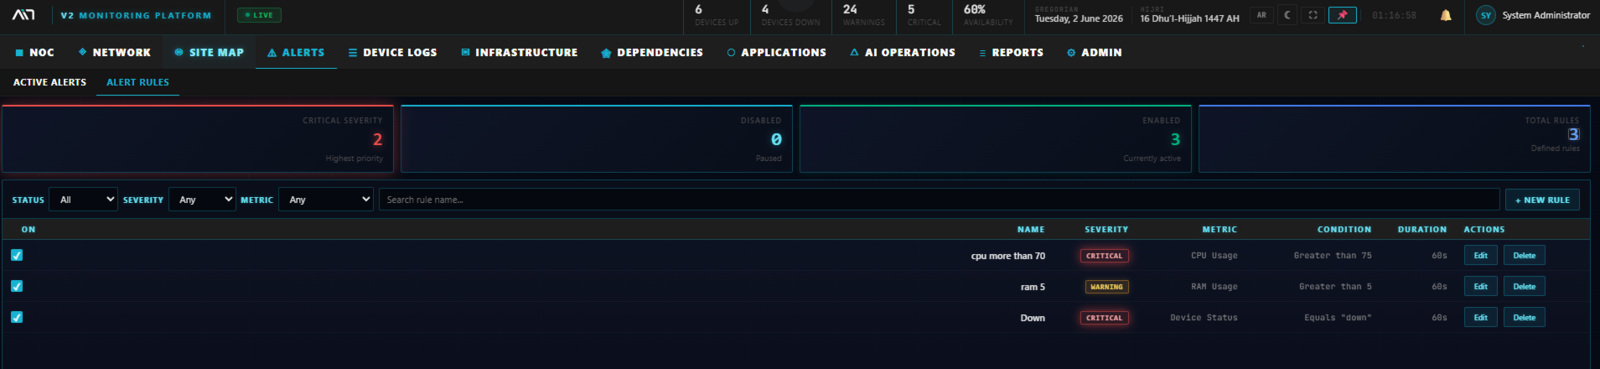
محرّك تنبيهات بقواعد قابلة للتخصيص، دمج تلقائي، وقنوات إشعار متعدّدة.An alerting engine with customizable rules, automatic deduplication, and multi-channel notifications.
- قواعد تنبيه قابلة للتخصيص بشروط مركّبة (AND/OR)
- ٤ مستويات خطورة: CRITICAL · WARNING · INFO · OK
- دمج تلقائي (Dedupe) للأحداث المتكررة لتقليل الضوضاء
- قواعد نمط الأحداث (Event Pattern Rules)
- قواعد افتراضية للنظام جاهزة من اليوم الأول
- نوافذ الصيانة (Maintenance Windows) لإيقاف التنبيهات
- تاريخ التنبيهات الكامل مع timeline تفاعلي
- Six severity levels (Info → Critical)
- Custom rules with dynamic thresholds
- Routing by department, device type, or time window
- Smart deduplication to prevent alert floods
- Automatic SLA tracking + computed MTTR
- Multi-channel notifications: email, SMS, webhooks
سجلات الأجهزة — كل الـSyslog والـSNMP Traps DEVICE LOGS · SYSLOG & SNMP TRAPS
مستقبِل Syslog/SNMP Trap عالي الأداء، تحليل ذكي، وكشف الأنماط المريبة.High-performance Syslog/SNMP Trap receiver, intelligent parsing, and suspicious-pattern detection.
- UDP Listener مخصّص لاستقبال الحجم العالي
- محلّلات منفصلة لـ Syslog و SNMP Traps
- Source Resolver — ربط تلقائي بمصدر الجهاز المسجّل
- Pipeline متعدد المراحل مع TimescaleDB hypertable
- كشف الأنماط (Event Pattern Detection) للأحداث المتسلسلة
- محرّك Dedupe لتجميع الأحداث المتشابهة
- WebSocket للسجلات الحيّة في الواجهة
- Three transport layers: UDP / TCP / TLS
- Sort by facility and severity, auto-link to known devices
- Indexed search for fast lookups
- TimescaleDB time-series storage with ~95% compression after 7 days
- Suspicious pattern detection
- Configurable retention policies
١٤ مسبار — صفر عميل 14 PROBES · ZERO AGENTS
وحدة INFRA مستقلة بقاعدة بيانات خاصة (TimescaleDB) و١٤ مسبار Python بدون أي عميل على الأجهزة.A standalone INFRA module with its own TimescaleDB database and 14 agentless Python probes.
- Servers — Windows (WMI/WinRM) · Linux (SSH)
- Databases — PostgreSQL · MySQL · SQL Server
- Web — IIS (PowerShell) · Nginx · Apache
- Containers — Docker (API) · Kubernetes (kubectl/API)
- Virtualization — VMware vCenter/ESXi
- Identity — Active Directory (LDAP)
- عقد إخراج مغلق (AdapterResult) — مفاتيح ثابتة لكل المسابر
- BatchWriter بـ SAVEPOINTs لمنع التراجع الكلّي
- Windows · Linux · VMware ESXi/vCenter
- Kubernetes · Docker · Active Directory
- MySQL · PostgreSQL · SQL Server · IIS
- 14 agentless Python probes
- Standalone TimescaleDB database
- BatchWriter with per-table independent SAVEPOINTs
- Closed-output AdapterResult contract
خرائط الاعتمادية — رؤية أعمق DEPENDENCY MAPS · DEEPER VISIBILITY
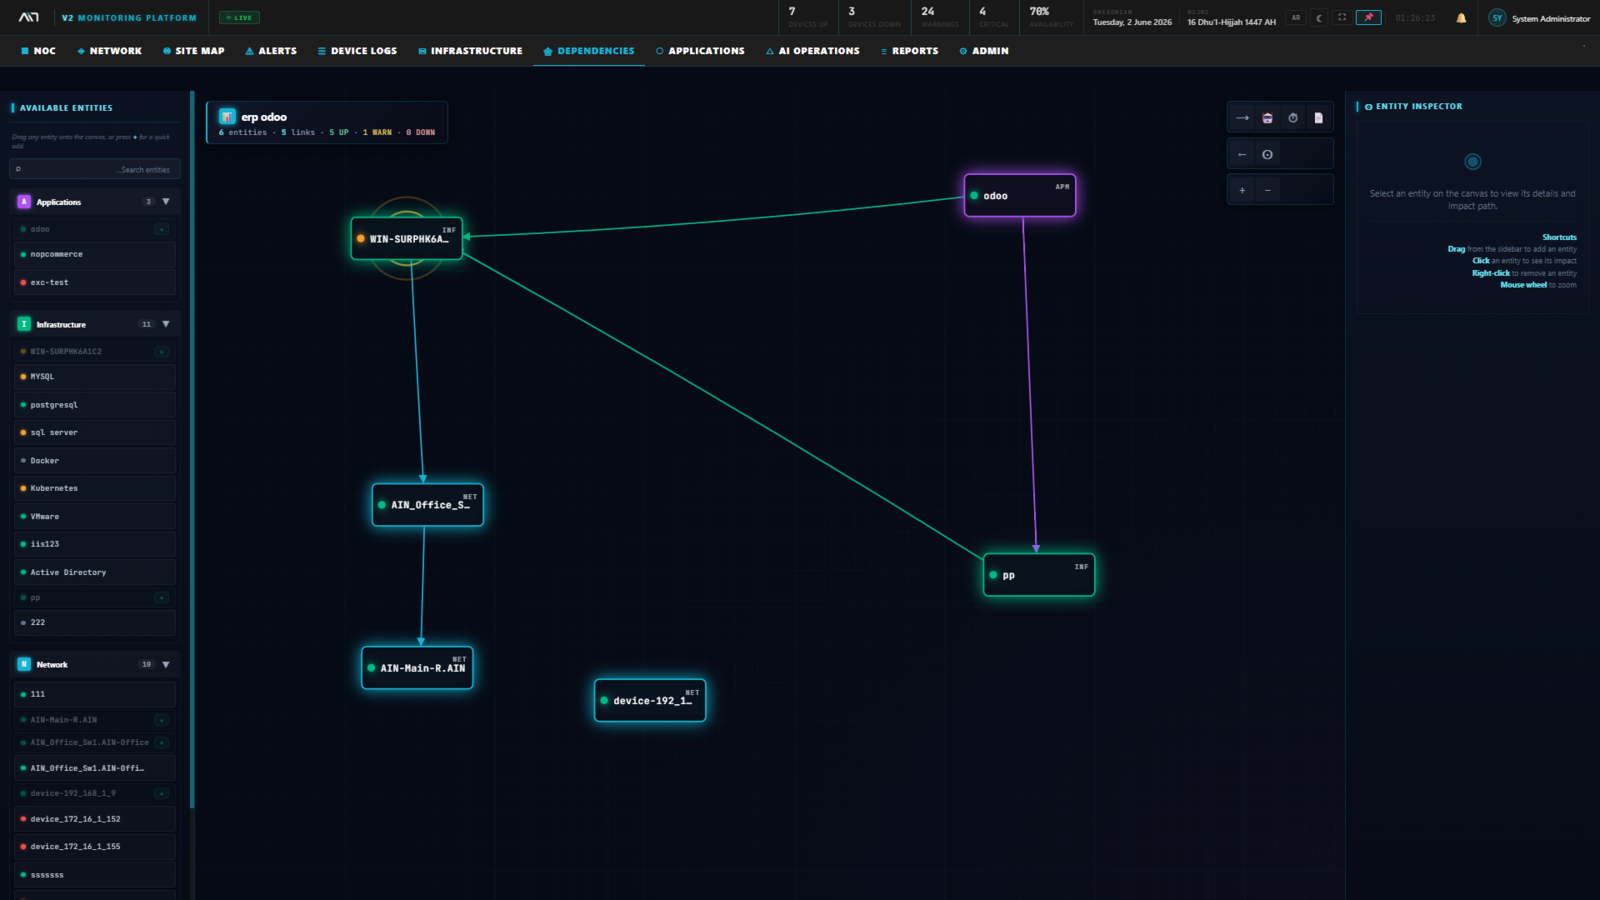
ارسم العلاقات بين خدماتك، اكتشف نقاط الفشل المنفردة، واحسب أثر أي انقطاع قبل ما يصير.Map relationships between services, surface single points of failure, and calculate outage impact before it happens.
- محرّر خرائط اعتمادية تفاعلي بسحب وإفلات
- تحليل أثر الانقطاع (Impact Analysis) آلي
- كشف نقاط الفشل المنفردة (Single Point of Failure)
- مجموعات اعتماد (Dependency Groups) بأسماء عربية
- عضويات الكيانات (Entity Membership) مرنة
- تصدير الخرائط HTML قابل للمشاركة
- Automatic visual dependency graph
- Outage-impact analysis ("what breaks if X goes down?")
- Identify single points of failure proactively
- Service-to-device and service-to-service links
- Filter by team, environment, or criticality
APM للتطبيقات الحرجة APM FOR MISSION-CRITICAL APPS
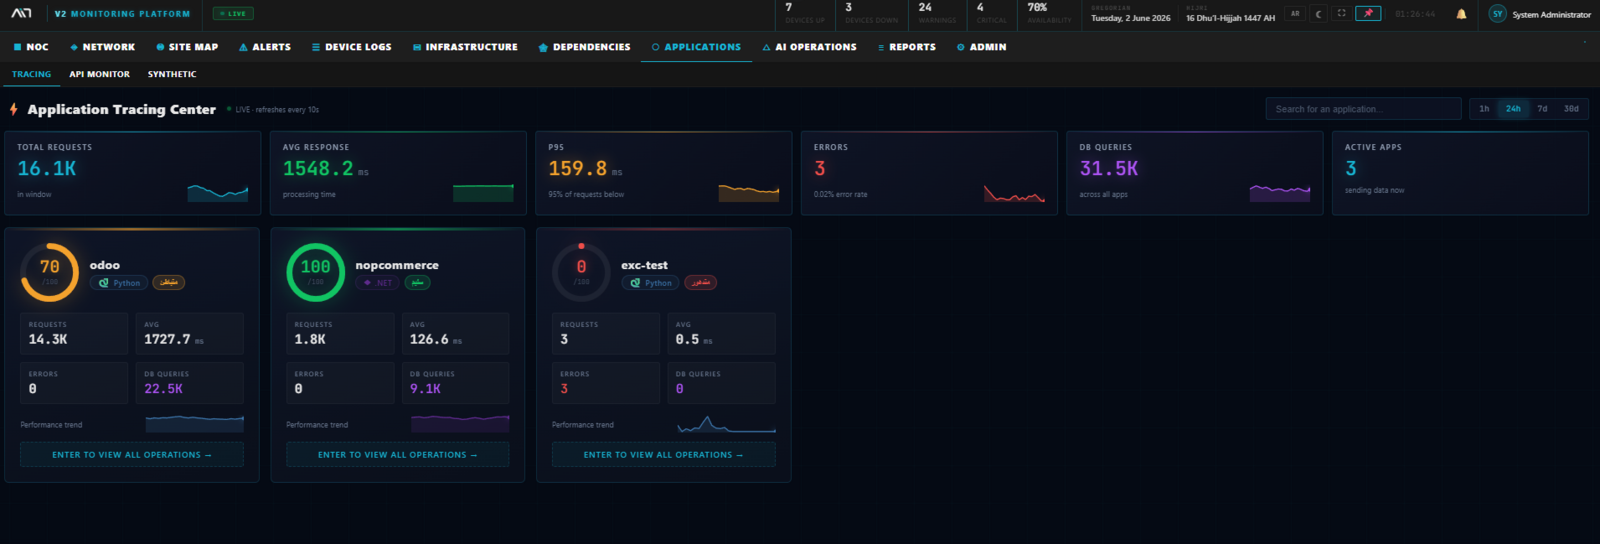
من تتبّع طلب واحد بكل تفاصيله، إلى مراقبة URL/API، إلى اختبارات Synthetic — كل شي.From single-request tracing in full detail to URL/API monitoring to synthetic checks — the full APM stack.
- Application Tracing — OpenTelemetry compatible (OTLP)
- Tracing Detail — Spans, DB queries, errors, performance trend
- URL/API Monitor — HTTPs checks مع latency و SSL
- Synthetic Monitoring — سيناريوهات متعددة الخطوات
- APM Score لكل تطبيق + ranking تلقائي
- Top consumers (Requests, DB Queries, Errors)
- Health scanner + Silent scanner للخدمات المتوقعة
- Full APM with latency, throughput, error rates
- Single-request tracing with full span hierarchy
- URL/API monitoring with custom assertions
- Synthetic checks from internal locations
- Python and .NET instrumentation supported
- Code-level performance breakdown
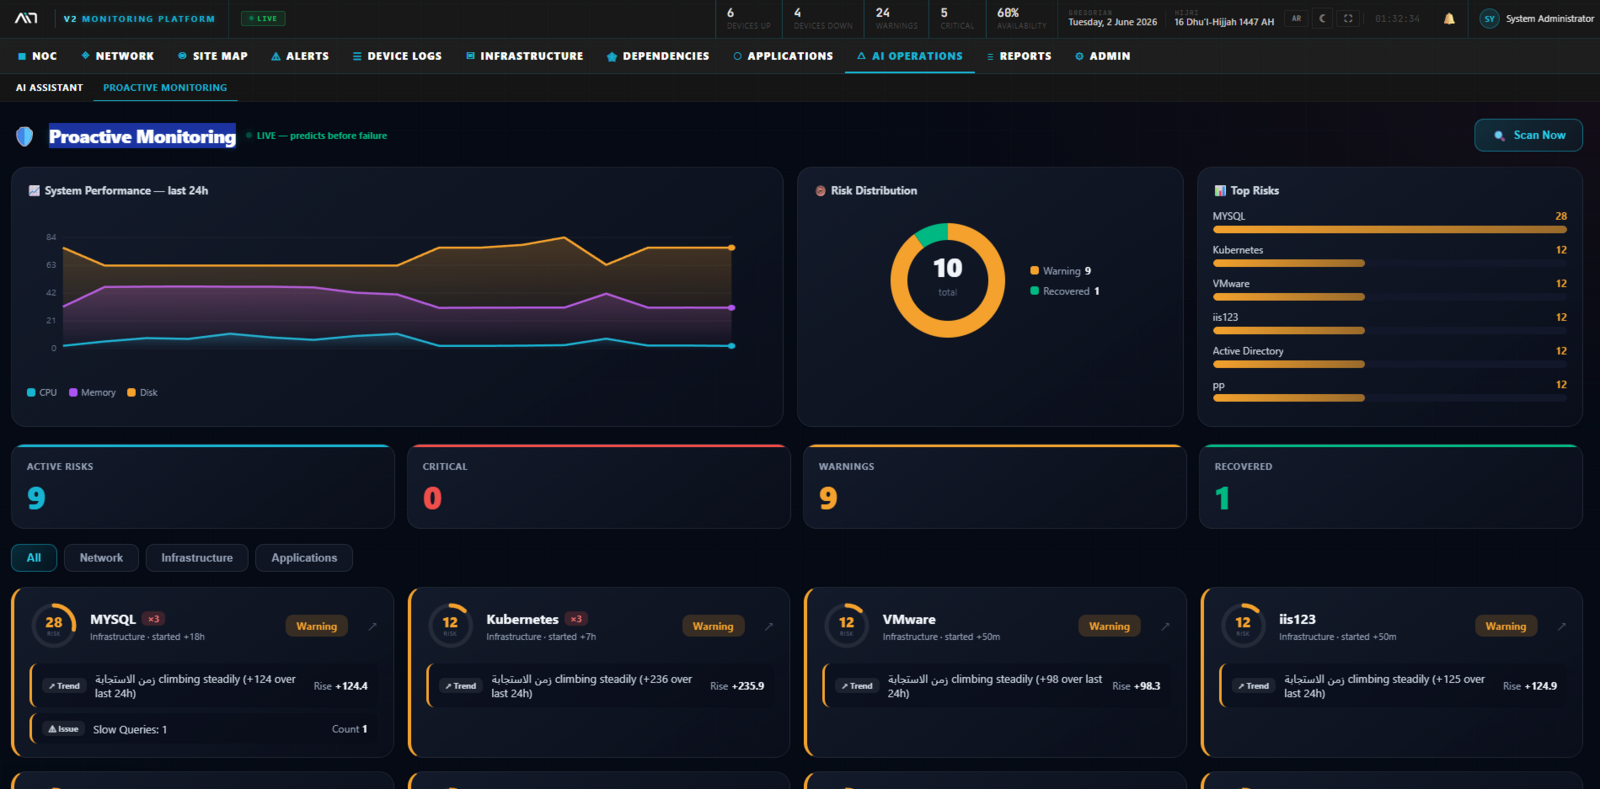
عَين الذكي — يحكي عربي AIN AI · SPEAKS ARABIC NATIVELY
مساعد ذكي يشتغل بالكامل محلياً (Ollama + qwen2.5)، يجاوب باللهجة السعودية، ويتنبّأ بالأعطال.A locally-hosted AI assistant (Ollama + qwen2.5) that answers in Saudi dialect and predicts failures before they occur.
- AI Assistant — محادثة طبيعية بالعربي مع جداول وصور
- Proactive Monitoring — نموذج يتنبّأ بالأعطال قبل وقوعها
- تدفّق توكن-بتوكن (SSE Streaming) — استجابة فورية
- ذاكرة محادثة متعددة الجولات (in-RAM LRU)
- تقارير ذكية مخصّصة لجهاز أو واجهة معيّنة
- سياسة "لا هلوسة" — يرفض الإجابة بدون مصدر
- RAG (Retrieval Augmented Generation) من قاعدة بياناتك
- Sandbox آمن لتنفيذ الاستعلامات المسموح بها فقط
- Local Ollama (qwen2.5:7b) — zero external connectivity
- Speaks Saudi dialect natively
- Token-by-token SSE streaming
- Multi-turn conversation memory
- Device-specific and interface-specific reports
- Proactive monitoring: anomaly detection, baselines, Z-score, EWMA
- Saudi UTC+3 timezone-aware reasoning
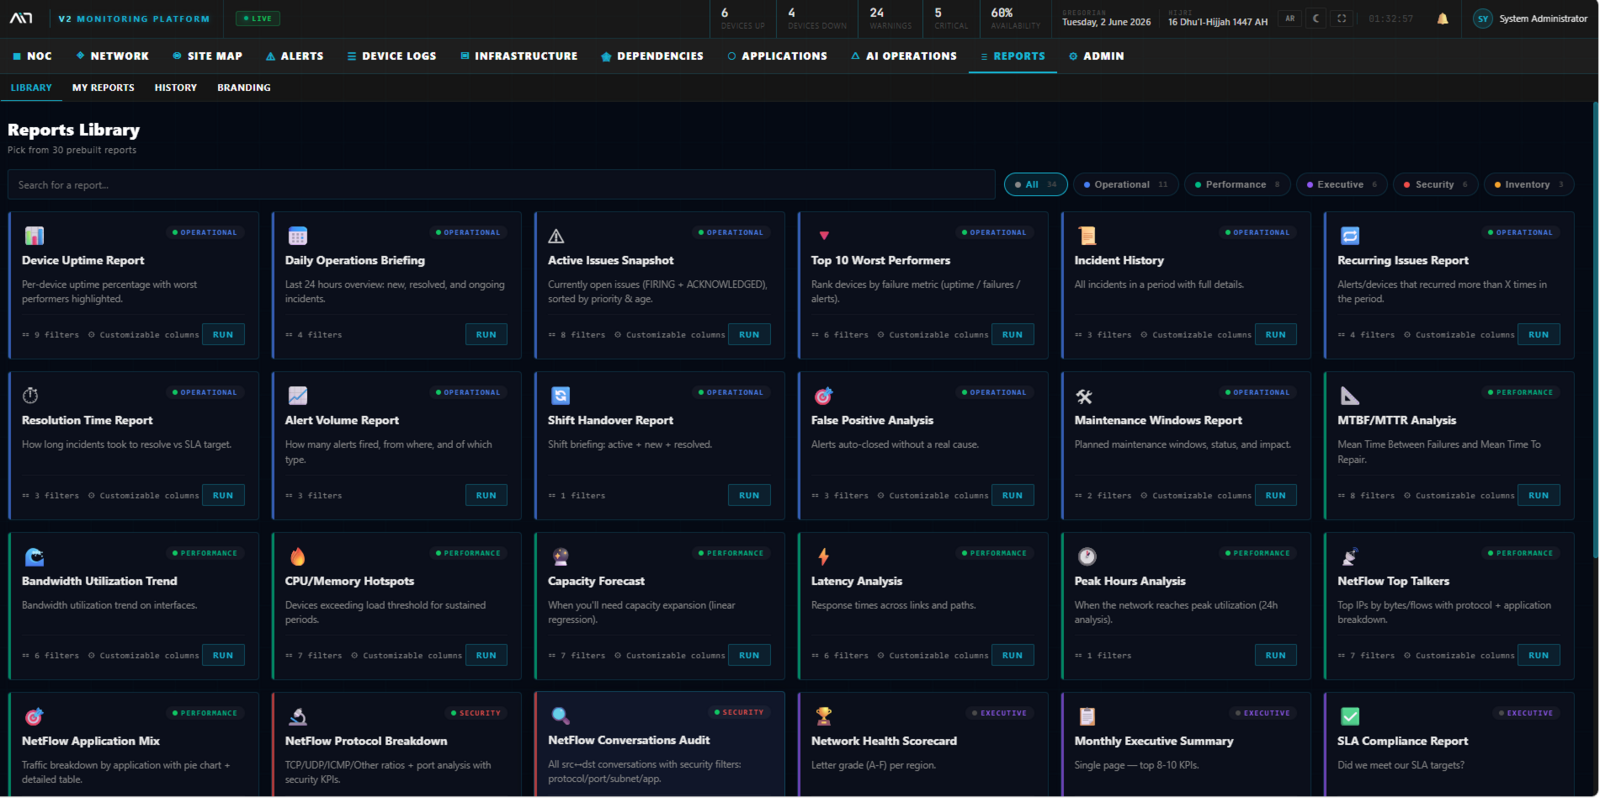
+20 تقرير ذكي جاهز 20+ READY-TO-RUN INTELLIGENT REPORTS
من تقارير SLA الرسمية لتقارير تسليم المناوبة اليومية — كلها جاهزة، قابلة للتصدير بصيغ متعدّدة.From formal SLA reports to daily shift-handover reports — all ready to run and exportable in multiple formats.
- Active Issues · Alert Volume · Incident History · MTBF/MTTR
- Device Uptime · Top/Worst Performers · CPU & Memory Hotspots
- Bandwidth Trend · Latency Analysis · Peak Hours · Capacity Forecast
- Daily Ops Briefing · Shift Handover · Maintenance Windows
- NetFlow Reports · Recurring Issues · False Positive Analysis
- تصدير: PDF (طباعة HTML) · Excel · CSV
- Branding مؤسسي مخصّص (شعار، ألوان، توقيع)
- تشغيل تلقائي مجدول + تاريخ كامل للتقارير
- Official SLA reports (daily / weekly / monthly)
- Incident reports with full root-cause timeline
- MTBF / MTTR by team, device, or service
- Capacity forecast and growth projections
- Daily shift handover
- Bandwidth consumption (Top Talkers, Top Conversations)
- Export to PDF, Excel, CSV
- Schedule reports automatically
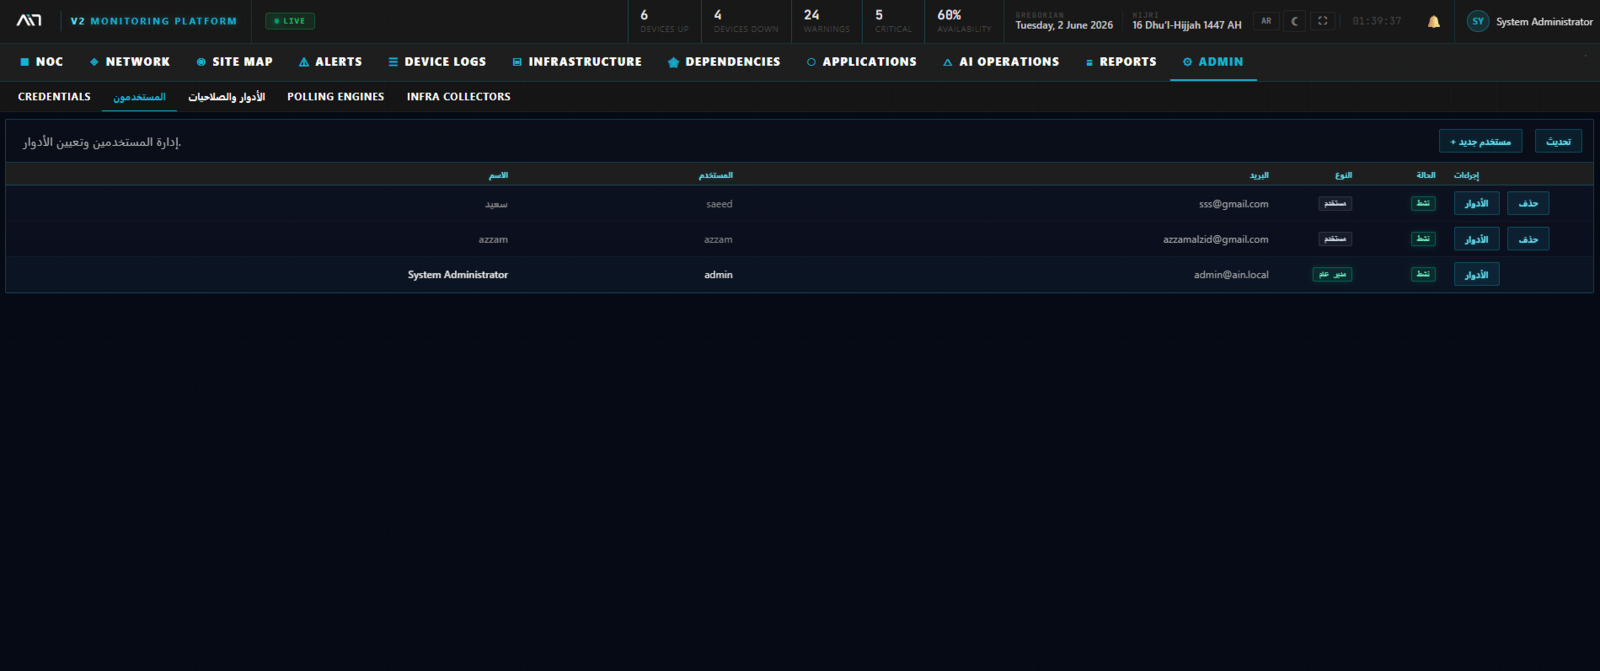
إدارة كاملة · أمان من الجذر FULL ADMIN CONTROL · SECURITY BY DESIGN
صلاحيات دقيقة، محرّكات استطلاع موزّعة، بيانات اعتماد مشفّرة، وعلامة مؤسسية كاملة.Granular permissions, distributed polling engines, encrypted credentials, and full enterprise branding.
- Users — إدارة المستخدمين، Sessions، API Tokens
- Roles & Permissions — RBAC بصلاحيات ذرّية + Permission Sync
- Polling Engines — محرّكات استطلاع موزّعة مع Sharding ذكي
- Credentials — تخزين مركزي مشفّر لكل بيانات الاعتماد
- Infra Collectors — إدارة المجمّعات + توزيع المهام
- Organization Branding — شعار، ألوان، اسم — تخصيص كامل
- Audit Log — تاريخ كامل لكل عملية في النظام
- Multi-Tenant — عزل تنظيمي صارم بمعرّف org_id
- User and role management with granular permissions
- Multi-tenant isolation at the ORM layer
- Distributed polling engines (sharding)
- Encrypted credential vault
- Full audit trail of every sensitive action
- Custom organizational branding
- Scheduled backups + restore tools
كل هذي القدرات في منصّة واحدةAll of this in one platform
تبغى تشوفها على أرض الواقع؟ احجز جلسة ديمو معنا وراح نوريك كيف عَين تشتغل في بيئة تشبه بيئتك.Want to see it in action? Book a demo and we'll show you how AIN runs in an environment like yours.